A new, better way to keep up with construction material cost changes
 Staying ahead of cost trends can feel like an uphill battle. Market volatility, geographical variations, and the lag between project initiation to build introduces unpredictability in the total cost of construction projects.
Working in uncertainty can lead to budget overruns, delays, and decreased profitability, making it challenging to keep up. But what if there was a solution that could turn these challenges into opportunities for success? To ensure success in any project, you need the ability to anticipate changes and make informed decisions.
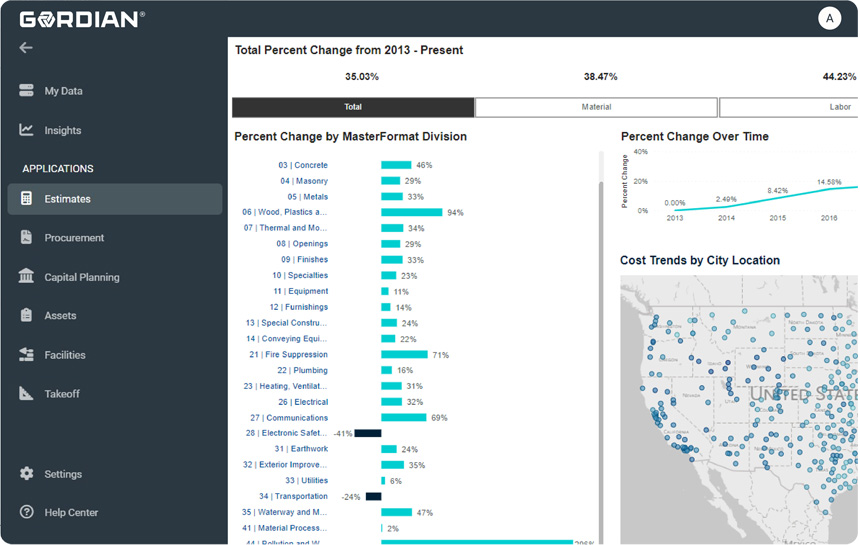
Turn data into actionable intelligence with Gordian’s new Data Insights—Cost Trends Dashboard, powered by RSMeans™ Data. Gordian’s Data Insights—Cost Trends empowers organizations to gain more insight into shifting cost trends across construction task categories and geographies—all within a single dashboard.
The Cost Trends Dashboard evaluates and adjusts your estimates and budgets with a systematic, automated way to access current cost trends at your fingertips. Data Insights—Cost Trends Dashboard allows you to:
- Strategically evaluate, adjust estimates and budgets with an objective and data-driven approach.
- Access granular insights across construction categories to make smarter decisions about project costs.
- Gain a competitive edge by unlocking historical cost trends across geographies.
- Communicate with clarity using data as a foundation to build trust within your organization.
All information listed in this section was submitted by Gordian.
Kenilworth Media Inc. cannot assume responsibility for errors of relevance,
fact or omission. The publisher does not endorse any products featured in this article.
Sign up for our weekly newsletter
Architectural materials and methods delivered right to your inbox
- CSI News and Notes: CSI Foundation’s construction camp; CSI spring exam; and more
- CSI News and Notes: CSI’s credentials; CSI conference theme; and more
- To be specific – CSI supports young AECO professionals
- CSI News and Notes: CSI’s foundation scholarships, national conference, and Crosswalk
- CSI News and Notes: AI’s impact; CSI 2024 conference, and more
Popular Articles
-
1
-
2
-
3
-
4
-
5
Read the Latest Issue