
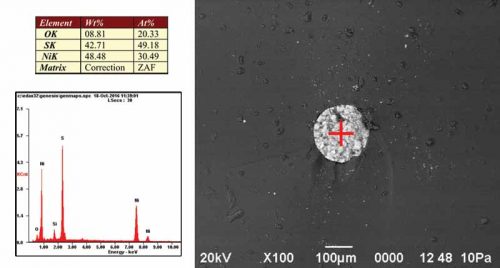
Figure 5: Zoomed-in view of NiS inclusion when viewed in a scanning electron microscope (SEM). SEM energy dispersive X-ray spectrometer (EDS) identifies the elemental composition of the inclusion including nickel and sulfur.
Image courtesy Simpson Gumpertz & Heger

