Fiber-cement panel siding nail head pull-through resistance
Test results and discussion
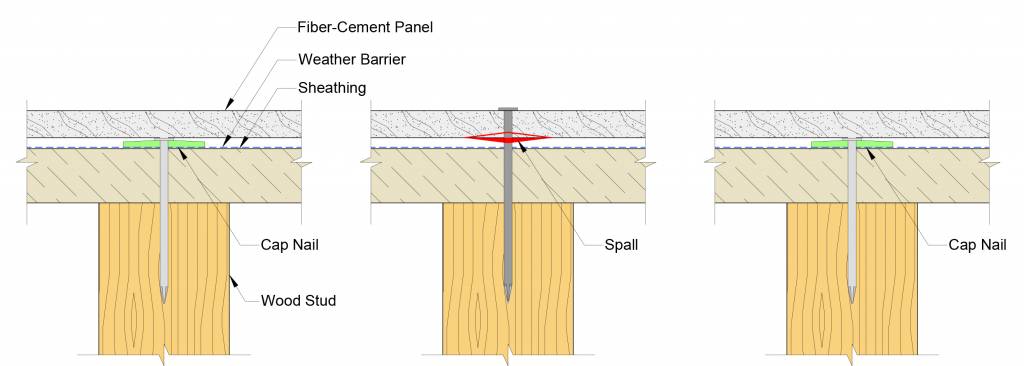
In general, the installation of nails using the pneumatic nailer (cases 2 and 3) created a spall on the inboard face of the test specimen. The spall was typically more pronounced for case 3 because of the unconstrained condition of the fiber-cement specimen due to the gap created by the cap nails. Figure 7 shows a typical spall created during nail installation. This spalling effectively reduces the cross-section of the specimen available to resist pull-through of the nail head. The cross-section is further reduced when the nail is overdriven (i.e. installed flush or recessed).
The failure mode for all tests involved additional spalling of the inboard face of the test specimens, resulting in a decrease in the measured load (see Figure 6). In some instances, the nail head completely pulled through the panel; however, tests were usually terminated when the load bearing capacity at the nail location was irrevocably lost.
Table 2 summarizes the data from the test program. For each set of six tests, the average maximum load, standard deviation, and coefficient of variation (abbreviated Avg. Max. Load, Std. Dev., and Coeff. of Var., respectively) are presented. To check for outliers, a Dixon’s Q test was performed for each set of six tests. With six values and at 95 percent confidence, a Q value of 0.625 was used. The only outlier identified was one of the Product A, case 3.c specimens. This outlier was omitted from the statistical data presented in Table 2. Figure 9 is a bar graph indicating the average maximum pull-through load for each product and test case. The error bars indicate plus and minus one standard deviation.
Table 2 – Summary of nail head pull-through test data.
| Test Case |
Nail Head Condition |
Product A | Product B | Product C | ||||||
| Avg. Max. Load |
Std. Dev. |
Coeff. of Var. |
Avg. Max. Load |
Std. Dev. |
Coeff. of Var. |
Avg. Max. Load |
Std. Dev. |
Coeff. of Var. |
||
| 1 | Proud | 992 N
(223 lbf) |
73.6 N
(16.5 lbf) |
7.4% | 1032 N
(232 lbf) |
37.2 N
(8.4 lbf) |
3.6% | 1012 N
(228 lbf) |
99.9 N
(22.5 lbf) |
9.9% |
| 2 | Proud | 661 N
(149 lbf) |
128.9 N
(29.0 lbf) |
19.5% | 820 N
(184 lbf) |
64.7 N
(14.5 lbf) |
7.9% | 818 N
(184 lbf) |
131.6 N
(29.6 lbf) |
16.1% |
| 3.a | Proud | 544 N
(122 lbf) |
121.8 N
(27.4 lbf) |
22.4% | 660 N
(148 lbf) |
83.1 N
(18.7 lbf) |
12.6% | 762 N
(171 lbf) |
168.5 N
(37.9 lbf) |
22.1% |
| 3.b | Flush | 164 N
(37 lbf) |
107.5 N
(24.2 lbf) |
65.4% | 546 N
(123 lbf) |
111.1 N
(25.0 lbf) |
20.3% | 441 N
(99 lbf) |
150.5 N
(33.8 lbf) |
34.1% |
| 3.c | Recessed | 84 N
(19 lbf) |
46.6 N
(10.5 lbf) |
55.5% | 242 N
(54 lbf) |
72.1 N
(16.2 lbf) |
29.8% | 284 N
(64 lbf) |
103.5 N
(23.3 lbf) |
36.5% |
For all three products, the average nail head pull-through resistance was greatest for the control case (case 1). Because holes for the nails were pre-drilled and the nails were installed proud, there was no reduction to the cross-section due to overdriven nail conditions or spalling on the inboard faces of the specimens. Conversely, the average pull-through resistance was consistently the least when the specimens were prepared over the substrate with the cap nails, and the nails were installed in the recessed condition (case 3.c). This is due to the section loss that results from the spalling of the inboard face of the specimen during the pneumatic installation of the nail combined with the local crushing introduced by the recessed condition of the nail head. As expected, the less sound material present around the nail head, the lower the load required to pull the nail head through the panel.
The following items further describe the reductions observed in the average nail head pull-through resistance test data for various test cases:
Sign up for our weekly newsletter
Architectural materials and methods delivered right to your inbox
- CSI News & Notes: CSI’s impact earns official recognition; celebrate leaders, mentors, and innovators; and more
- CSI News and Notes: CSI spring certification exams open; scholarships available; and more
- CSI News & Notes: CSI MSR heading to San Diego; spring certification exams open; and more
- To Be Specific: Why CDT Should Be Your First Move
- CSI News & Notes: CSI Fellows share member benefits; and a New Year’s Resolution to keep
Related Products

Read the Latest Issue