

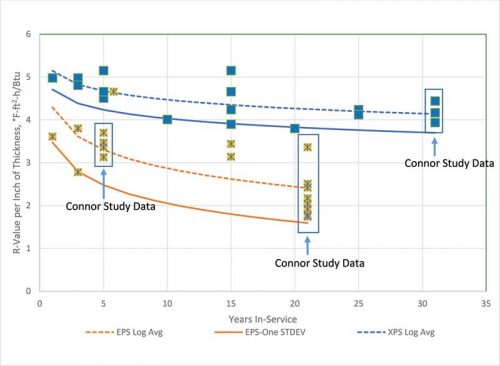
Figure 1: Thermal resistance (R-value per inch) versus years in service. This graph plots the data points presented by Billy Connor, PE, in his study, “Comparison of Polystyrene Expanded and Extruded Foam Insulation in Roadway and Airport Embankments.” Also shown are the best fit average curve and the best fit average curve minus one standard deviation for expanded and extruded polystyrene (EPS and XPS) insulation samples, as given by Connor in equation form.

