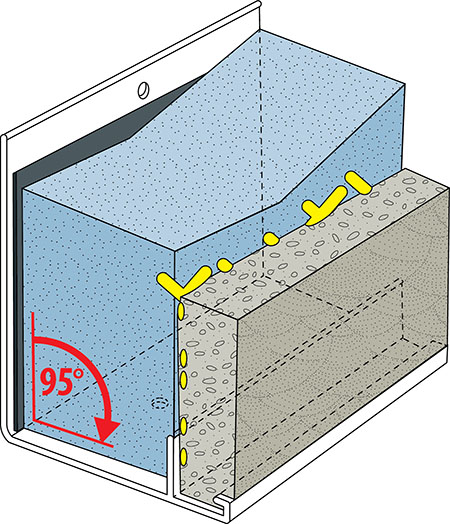
XPS delivers high R-values in below-grade applications

Photo courtesy Kingspan
The EPS samples in the Connor study were subject to below-grade conditions for five years (Dalton Highway, Alaska) and 21 years (Cripple Creek Highway, Alaska). These sites were randomly selected because these insulated roadways were scheduled for maintenance and repair. Thus, the opportunity was presented to extract and evaluate in-situ foam insulation as part of the natural course of roadway and airfield repair and maintenance. The XPS insulation materials were subject to below-grade conditions for 31 years (Golivan Airport, Alaska).
The samples provide additional performance data for EPS and XPS after 21 and 31 years in service, respectively. The EPS and XPS samples extracted from the below-grade locations were studied extensively. The researchers found a distinct difference in effective R-value and water absorption performance.
The multiple sites allow performance to be examined across a wide range of conditions with a sample size sufficient to reveal long-term trends. During these long periods of time in service, the polystyrene insulation samples were exposed to the effects of aging, moisture absorption, drying, and compressive forces. Combining data from all three studies for EPS and XPS, respectively, sample sizes are 19 and 21; and the oldest ages in service are 21 and 31 years.
The Connor study test results indicate a rapid drop in R-value per inch for EPS in the first five years in service (with the in-service R-values per inch ranging from 3.13 to 3.70). By comparison, the R-values per inch for XPS only dropped gradually after five years in service on previously measured XPS samples (with R-values per inch ranging from 4.51 to 5.15). Further, the Connor study showed the R-values per inch for XPS decreased gradually, levelling out to an average value of about 4.1 after 31 years in service. By comparison, R-values per inch for EPS decreased rapidly, levelling out to an average value of about 2.2 after 21 years in service.
Figure 1 graphs the data points for in-service R-value per inch as reported in the Connor study. The new data points confirm previous results indicating higher R-value per inch for XPS compared to EPS. In fact, the new results indicate the previous results underestimated the decrease in EPS thermal resistance over time.
The Connor study develops the concept of average in-service R-value per inch minus one standard deviation (solid line in Figure 1) as a way to calculate insulation thicknesses needed to account for in-service exposure to severe below-grade environments.
Several other procedures and corresponding multipliers are proposed to account for decreases in R-values per inch with the length of time in service. Regardless of the procedure, the Connor study concludes EPS need to be 1.5 to two times thicker than XPS to equal the latter’s thermal performance.
Implications for further research
Factors influencing the performance of insulation in its application include R-values, moisture, temperature, aging, adjacent soil composition, water drainage, and material quality. All XPS and EPS polystyrene products are classified into types, according to small-scale laboratory comparative tests using ASTM C578, CAN/ULC S701.1 or the American Association of State Highway and Transportation Officials (AASHTO) M230, Standard Specification for Expanded and Extruded Foam Board (Polystyrene), specifications. It is misleading to extrapolate these small-scale results to imply an exact representation (or design value) of field performance, especially considering the many variables mentioned above.
For example, long-term thermal resistance (LTTR), or aging, which is based on a short-term, small-scale laboratory test, is inaccurately assumed by some to be the design R-value and the single most important product criteria (long-term thermal resistance [LTTR] represents the 15-year time weighted average R-value, equivalent to five-year storage at standard laboratory conditions and is defined as the design thermal resistance value). A single, small-scale test characteristic such as aging does not accurately predict the in-service design thermal resistance of insulation, especially when the actual field performance of the material has already been demonstrated in extreme real-life environments.
Further, a field study in one region of the country may not accurately predict the same performance in all regions of the country, considering the various different climates and soil conditions. Fortunately, these three studies examined multiple climates with severe freeze/thaw cycling such as Fairbanks, Alaska, and Québec. The studies provide critical long-term data, whereas the small-scale testing methods used to classify polystyrene are not indicative of performance over a period of time. The specifier is responsible to ensure this research data is applicable to their climatic region.
Another important finding of the Connor study points to the drawbacks of using small-scale moisture absorption testing as a predictor of in-service performance. Besides measurements of R-value per inch, moisture absorption was measured on all of the samples. The Connor study sought to correlate ‘water by volume’ data points with the R-value per inch data points. One EPS product claimed to have the same moisture absorption as XPS based on small-scale laboratory testing (as required by ASTM C578), yet the in-service performance was substantially different.
In other words, the improved EPS small-scale moisture absorption test results did not statistically improve the already rapid EPS R-value degradation due to in-service moisture absorption. In these studies, the relative difference in moisture absorption helps to explain the degradation in R-values below-grade when in-service. XPS absorbed less moisture than EPS on average in all of the studies. Hence, the need for a thickness ratio applied to EPS products for thermal equivalency.
Conclusion
In summary, through scientific study and empirical evidence, the resilience of XPS has been reaffirmed.
The study suggests small-scale tests used to classify products per ASTM C578 or CAN/ULC S701.1 do not account for the actual performance reductions in the field. Moisture absorption with EPS has a greater negative impact on in-service R-value than moisture absorption and aging with XPS. In harsh, below-grade applications, the research indicates that after moisture absorption very little drying of EPS and XPS occurs in-service.
As the most recent of three such studies, the Connor study confirms the higher thermal resistance of XPS compared to EPS. This can be attributed to the higher nominal R-value per inch of thickness of XPS and to the lower moisture absorption rate of XPS when compared to EPS. Further, the Connor study recommends an EPS-to-XPS thickness ratio of 1.5 to two (the author would like to appreciate the contributions made from members and associates of the Extruded Polystyrene Foam Insulation Association [XPSA] for the development of this article with special thanks to Rob Brooks, Rob Brooks & Associates, LLC, Eagle, Idaho; Barbara Fabian, Owens-Corning, Tallmadge, Ohio; Jeremy Smith, Kingspan, Atlanta, Georgia; and Guy Titley, Dupont, Sarnia, Ontario, Canada).
 John Woestman is director of codes and standards to the Extruded Polystyrene Foam Association (XPSA). He has more than 30 years of experience in the building products industry with various responsibilities in construction, manufacturing, human resources, and marketing as well as codes, standards, and regulations. He graduated with a diploma in building trades, a degree in mechanical engineering, and an MBA. Woestman is a member of the International Code Council (ICC), the National Fire Prevention Association (NFPA), and ASTM International. He can be reached at jwoestman@kellencompany.com.
Sign up for our weekly newsletter
Architectural materials and methods delivered right to your inbox
- CSI News and Notes: CSI Foundation’s construction camp; CSI spring exam; and more
- CSI News and Notes: CSI’s credentials; CSI conference theme; and more
- To be specific – CSI supports young AECO professionals
- CSI News and Notes: CSI’s foundation scholarships, national conference, and Crosswalk
- CSI News and Notes: AI’s impact; CSI 2024 conference, and more
Products


Read the Latest Issue